
Contents:
1. Basic python
- Statement Assignment
- print()
- list/list slice
- for loop + range
- str()
2. Third-party modules
Let's Start!
Open Excel with Openpyxl
In [38]:
import openpyxl
wb = openpyxl.load_workbook('Docs\D1_01.xlsx')
wb
Out[38]:
How to Get Sheet
List ALL sheets I can get
In [39]:
wb.get_sheet_names()
Out[39]:
In [40]:
sh2 = wb.get_sheet_by_name('Sheet2')
sh2
Out[40]:
The Title of Sheet
In [41]:
sh2.title
Out[41]:
Get The Active Sheet
In [42]:
activeSheet = wb.active
activeSheet
Out[42]:
How to Get Value in Sheet
In [43]:
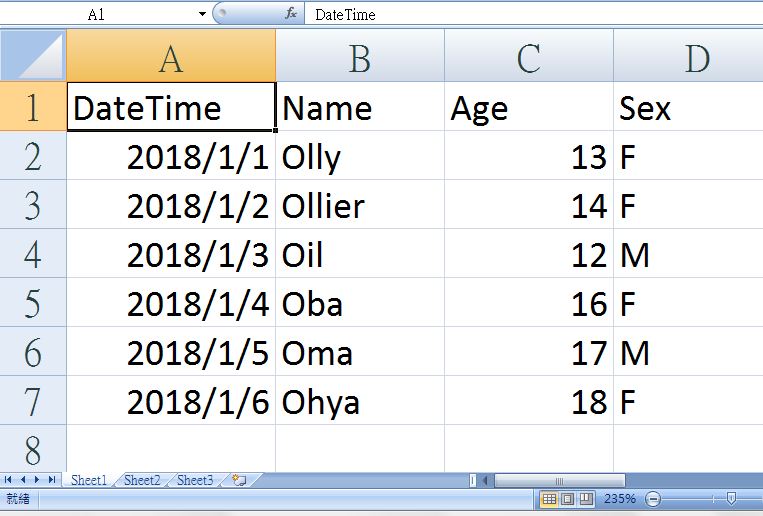
sh1 = wb.get_sheet_by_name('Sheet1')
sh1['A1'].value
Out[43]:
In [44]:
sh1['A2'].value
Out[44]:
In [45]:
sh1.cell(row=2,column=2).value
Out[45]:
In [46]:
for i in range(1,5):
    print(i, sh1.cell(row=i, column=2).value)
Get Max Row & Max Column
In [47]:
sh1.max_row
Out[47]:
In [48]:
sh1.max_column
Out[48]:
Get Column Letter & Get Index
In [49]:
from openpyxl.utils import get_column_letter,column_index_from_string
In [50]:
get_column_letter(1)
Out[50]:
In [51]:
get_column_letter(27)
Out[51]:
In [52]:
column_index_from_string('B')
Out[52]:
In [53]:
column_index_from_string('AB')
Out[53]:
Get a Cell Zone
In [54]:
sh1['A2':'D3']
Out[54]:
In [55]:
for i in sh1['A2':'D3']:
    print(i)
In [56]:
for i in sh1['A2':'D3']:
    for k in i:
        print(k)
In [57]:
for i in sh1['A2':'D3']:
    for k in i:
        print(k.coordinate, '=', k.value)
    print('★~~~~~~~ End of row ~~~~~~~★')
Get Specific Row & Column
In [58]:
sh1[2]
Out[58]:
In [59]:
for i in sh1[2]:
    print(i.value)
In [60]:
sh1['B']
Out[60]:
In [61]:
for i in sh1['B']:
    print(i.value)
Modify Sheet Name
In [62]:
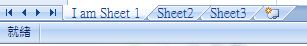
sh1.title = 'I am Sheet 1'
sh1.title
Out[62]:
In [63]:
wb.save('Docs\D1_02.xlsx')
Create & Delete Sheet
In [64]:
import openpyxl
wb = openpyxl.Workbook()
wb.get_sheet_names()
Out[64]:
In [65]:
wb.create_sheet()
wb.get_sheet_names()
Out[65]:
In [66]:
wb.create_sheet(index=0, title='Fist Sheet')
wb.get_sheet_names()
Out[66]:
In [67]:
wb.create_sheet(index=2, title='Middle Sheet')
wb.get_sheet_names()
Out[67]:
In [68]:
wb.remove_sheet(wb.get_sheet_by_name('Sheet'))
wb.get_sheet_names()
Out[68]:
In [69]:
wb.save('Docs/D1_03.xlsx')
![]()
Fill Value into Cell
In [70]:
wb = openpyxl.Workbook()
sh = wb.active
In [71]:
sh['A1'] = 'My First Value'
sh['A1'].value
Out[71]:
In [72]:
wb.save('Docs/D1_04.xlsx')
![]()
Set Font
In [73]:
from openpyxl.styles import Font
wb = openpyxl.Workbook()
sh = wb.active
In [74]:
FontStyle = Font(name='Calibri', size=50, italic=True, bold=True)
sh['A1'].font = FontStyle
sh['A1'] = 'Hello Font'
In [75]:
wb.save('Docs/D1_05.xlsx')
![]()
Set Algorithms
In [76]:
wb = openpyxl.Workbook()
sh = wb.active
In [77]:
sh['A1'] = 10
sh['A2'] = 20
sh['A3'] = 30
sh['A4'] = '=SUM(A1:A3)'
In [78]:
wb.save('Docs/D1_06.xlsx')
![]()
Set Height & Width for Row & Column
In [79]:
wb = openpyxl.Workbook()
sh = wb.active
In [80]:
sh['A1'] = 'Tall Row'
sh['B2'] = 'Wide Column'
In [81]:
sh.row_dimensions[1].height = 50
sh.column_dimensions['B'].width = 30
In [82]:
wb.save('Docs/D1_07.xlsx')
![]()
Merge cells
In [83]:
wb = openpyxl.Workbook()
sh = wb.active
In [84]:
sh.merge_cells('A1:C3')
sh['A1'] = '9 Cells Merged Together!'
sh.merge_cells('C5:D5')
sh['C5'] = 'Two Merged Cells~'
In [85]:
wb.save('Docs/D1_08.xlsx')
![]()
Unmerge Cells
In [86]:
wb = openpyxl.load_workbook('Docs/D1_08.xlsx')
sh = wb.active
In [87]:
sh.unmerge_cells('A1:C3')
sh.unmerge_cells('C5:D5')
In [88]:
wb.save('Docs/D1_08.xlsx')
![]()
Freeze Cells
| Freeze_panes | Freeze Rows & Columns |
|---|---|
| freeze_panes = 'A2' | Row 1 |
| freeze_panes = 'B1' | Column A |
| freeze_panes = 'C1' | Column A & B |
| freeze_panes = 'C2' | Row1 & Column A & Column B |
| freeze_panes = 'A1' | Non Freeze |
| freeze_panes = None | Non Freeze |
In [89]:
wb = openpyxl.load_workbook('Docs/D1_01.xlsx')
sh = wb.active
In [90]:
sh.freeze_panes = 'A2'
In [91]:
wb.save('Docs/D1_09.xlsx')
![]()
Plot
| Chart Type | Function |
|---|---|
| Bar Chart | openpyxl.chart.BarChart() |
| Line Chart | openpyxl.chart.LineChart() |
| Scatter Chart | openpyxl.chart.ScatterChart() |
| Pie Chart | openpyxl.chart.PieChart() |
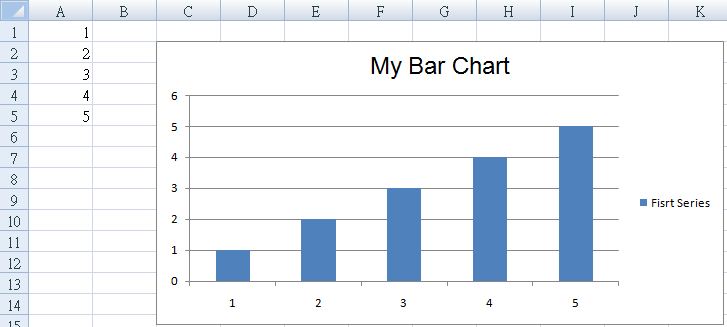
In [92]:
wb = openpyxl.Workbook()
sh = wb.active
In [93]:
for i in range(1, 6):
    sh['A' + str(i)] = i
In [94]:
ref = openpyxl.chart.Reference(sh,
                               min_col = 1,
                               min_row = 1,
                               max_col = 1,
                               max_row = 5)
ser = openpyxl.chart.Series(ref, title='Fisrt Series')
In [95]:
barChart = openpyxl.chart.BarChart()
barChart.title = 'My Bar Chart'
barChart.append(ser)
In [96]:
sh.add_chart(barChart, 'C2')
In [97]:
wb.save('Docs/D1_10.xlsx')
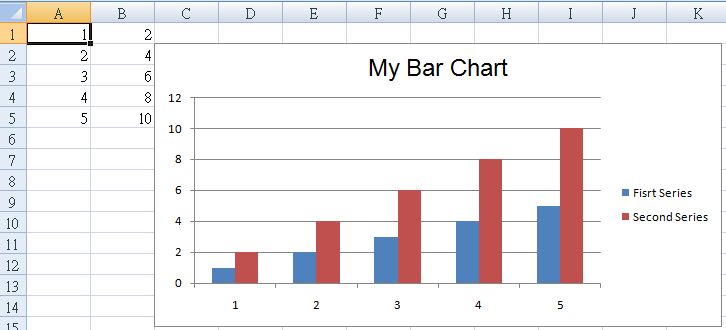
Example 1
In [98]:
import openpyxl
from openpyxl.chart import BarChart, Reference, Series

wb = openpyxl.Workbook()
sh = wb.active

for i in range(1, 6):
    sh['A' + str(i)] = i
    sh['B' + str(i)] = i*2

ref1 = Reference(sh, min_col = 1, max_col = 1, min_row = 1, max_row = 5)
ser1 = Series(ref1, title='Fisrt Series')
ref2 = Reference(sh, min_col = 2, max_col = 2, min_row = 1, max_row = 5)
ser2 = Series(ref2, title='Second Series')

barChart = BarChart()
barChart.title = 'My Bar Chart'
barChart.append(ser1)
barChart.append(ser2)

sh.add_chart(barChart, 'C2')
In [99]:
wb.save('Docs/D1_11.xlsx')
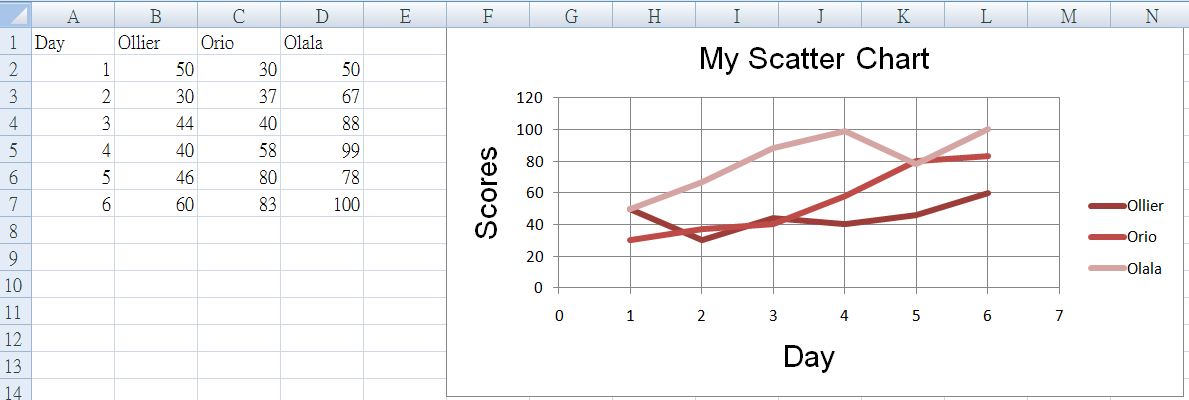
Example 2
In [100]:
import openpyxl
from openpyxl.chart import ScatterChart, Reference, Series

wb = openpyxl.Workbook()
sh = wb.active

rows = [['Day', 'Ollier', 'Orio', 'Olala'],
        [1, 50, 30, 50],
        [2, 30, 37, 67],
        [3, 44, 40, 88],
        [4, 40, 58, 99],
        [5, 46, 80, 78],
        [6, 60, 83, 100],]

for row in rows:
    sh.append(row)

chart = ScatterChart()
chart.title = "My Scatter Chart"
chart.style = 12
chart.x_axis.title = 'Day'
chart.y_axis.title = 'Scores'

xvalues = Reference(sh, min_col=1, max_col=1, min_row=2, max_row=7)
for i in range(2, 5):
    values = Reference(sh, min_col=i, max_col=i, min_row=1, max_row=7)
    series = Series(values, xvalues, title_from_data=True)
    chart.series.append(series)

sh.add_chart(chart, "F1")
In [ ]:
wb.save('Docs/D1_12.xlsx')
Exercise
Work with Execel File in Python
- Import ipenpyxl
- Create a workbook
- Modify sheet named (e.g 'My Sheet')
- Fill cell with any value with column name
- Change word with font function
- Plot with the value in your excel sheet